WORM UNTWISTING THE CAENORHABDITIS ELEGANS EMBRYO
PROJECT COLLABORATORS
PUBLICATION
PROJECT BRIEF
The nematode Caenorhabditis elegans possesses a simple embryonic nervous system with few enough neurons that the growth of each cell could be followed to provide a systems-level view of development. However, studies of single cell development have largely been conducted in fixed or pre-twitching live embryos, because of technical difficulties associated with embryo movement in late embryogenesis. We present open-source untwisting and annotation software (http://mipav.cit.nih.gov/plugin_jws/mipav_worm_plugin.php) that allows the investigation of neurodevelopmental events in late embryogenesis and apply it to track the 3D positions of seam cell nuclei, neurons, and neurites in multiple elongating embryos. We also provide a tutorial describing how to use the software (Supplementary file 1) and a detailed description of the untwisting algorithm (Appendix). The detailed positional information we obtained enabled us to develop a composite model showing movement of these cells and neurites in an 'average' worm embryo. The untwisting and cell tracking capabilities of our method provide a foundation on which to catalog C. elegans neurodevelopment, allowing interrogation of developmental events in previously inaccessible periods of embryogenesis.
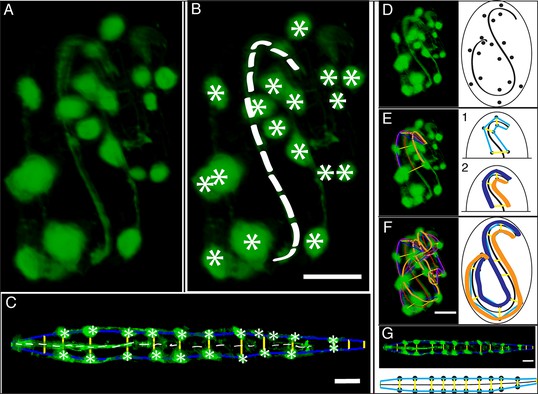
(A) An image of a threefold embryo in the twisted state, showing the untwisting markers. (B) The same image as in (A) with the untwisting markers labeled. Asterisks mark seam cell nuclei, and the dashed line indicates the midline marker. (C) The same embryo as in (A, B), after untwisting. Asterisks and dashed line as in B. (D–F) Further detail lattice creation and splines that model embryo. (D) Left: same embryo volume as in (A). Right: accompanying schematic showing the seam cell nuclei in the twisted embryo (black circles) and midline (interior black line). (E) Lattice creation. As diagrammed in right schematic, parts (1) and (2), the user adds points to create a lattice (blue and yellow lines). After the lattice is built, the algorithm generates splines defining the edges of the worm (orange and purple lines) automatically. The midline is also defined with a spline (red line at left). (F) The embryo volume and accompanying schematic showing a completed lattice and model. (G) The embryo volume and accompanying schematic after untwisting. All scale bars: 10 μm.
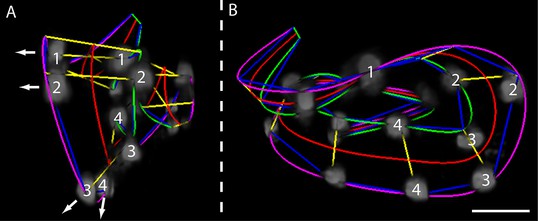
(A) Evidence for helical twisting, highlighted on four pairs of consecutive seam cell nuclei. If no helical twisting occurs, yellow lines (connecting seam cell nucleus pairs) should appear parallel to each other when sighting down the midline of the worm (red line). If helical twisting is present, yellow lines should appear to twist about the midline. Arrows denote the direction of lines for four pairs of consecutive seam cell nuclei: note obvious and apparent angular twist between pairs 1 and 4. (B) Side view showing same data as in (A). As before, nuclei pairs 1 and 4 appear in close to perpendicular orientation to each other, despite the roughly parallel midline. Scale bar: 10 μm.
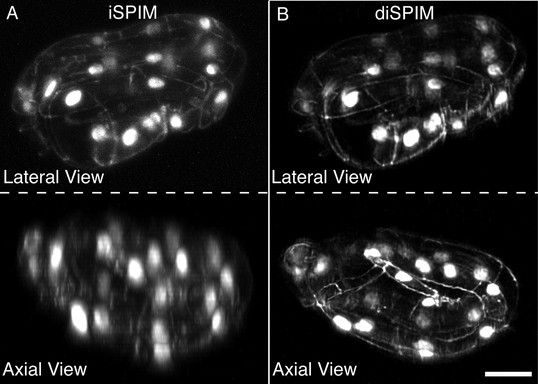
Coarse features such as seam cell nuclei are visible in single view iSPIM (A), but finer features such as junctions between hypodermal cells labeled with DLG-1::GFP are better resolved in the diSPIM (B), particularly in the axial direction (lower row). Scale bar: 10 μm. diSPIM, dual-view Selective Plane Illumination Microscopy; iSPIM, inverted Selective Plane Illumination Microscopy.
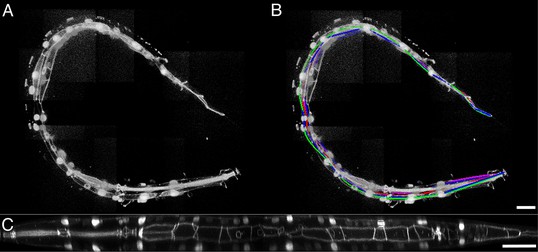
(A) The twisted L2 larval volume displayed in the MIPAV volume renderer. (B) The twisted L2 larva after lattice-building. (C) The L2 larval worm after untwisting. See also Video-7. MIPAV, Medical Image Processing, Analysis, and Visualization
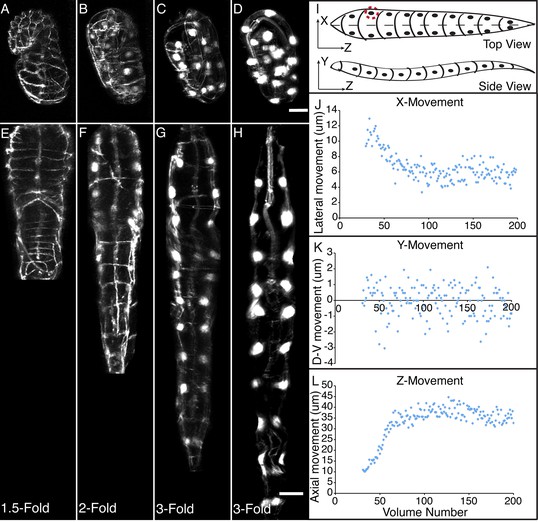
Selected volumetric timepoints pre (A–D) and post (E–H) untwisting, with canonical state of embryo indicated at bottom. See also Video-2. (I) Cartoon of untwisted embryo, indicating coordinate system. (J–L) X, Y, and Z movements of circled seam cell nucleus in (I). Measurements are indicated relative to the animal’s nose, fixed as the origin in all untwisted datasets. All scalebars: 10 μm.
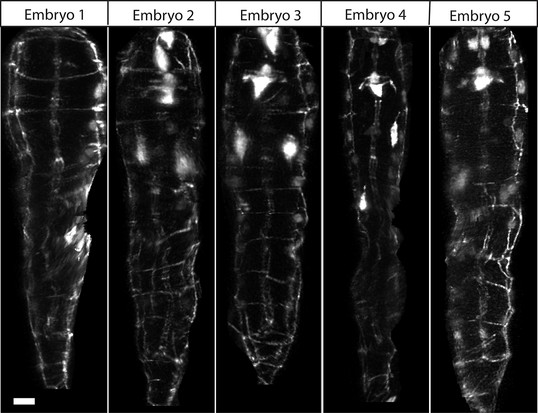
Comparative timepoints were selected based on the H1R seam cell shifts. Max projections of volumetric images are shown. Note the underlying similarity in overall shape across animals. Scalebar: 5 μm.
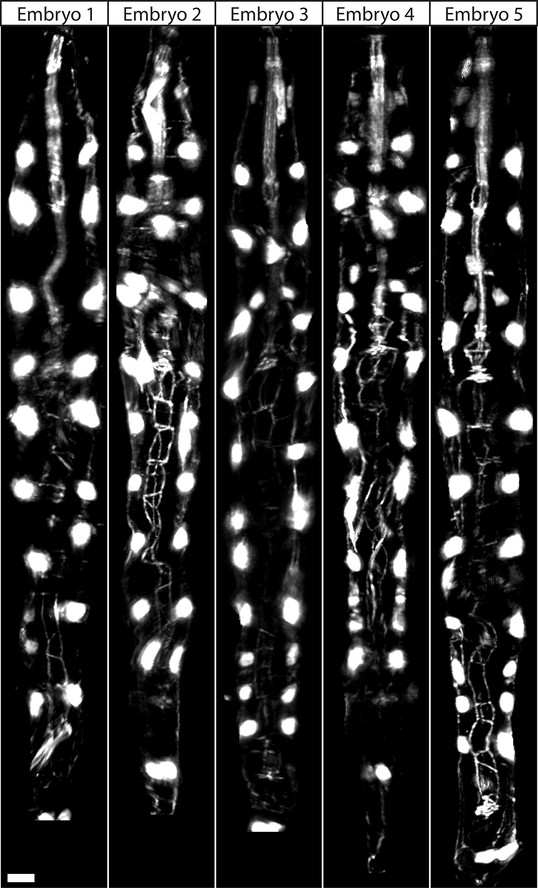
Comparative timepoints were selected based on the H1R seam cell shifts. Max projections of volumetric images are shown. Note the underlying similarity in overall shape and seam cell positions across animals. Scalebar: 5 μm.