GPU 3D VISUALIZATION FRAMEWORK
PROJECT COLLABORATORS
PUBLICATION
PROJECT BRIEF
MIPAV visualization framework provides free off-the-shelf sophisticated 3D computer graphics, modeling, simulation, volume rendering, and 3D segmentation. It also includes ancillary support for 3D interaction, 3D annotation, and parallel computing. Within its core, the MIPAV 3D viewer is implemented in Java with Jogl (Java OpenGL), GLSL (OpenGL shading language), and OpenCL toolkit, and allows developers and researchers to quickly build new and novel medical 3D applications. By leveraging the modern GPU technology, the current MIPAV 3D visualization framework achieves: 1) high rendering quality with extremely fast rendering speed (even with Java environment); 2) Smooth and convenient 3D user interaction; 3) 3D stereoscopic viewing with Nvidia 3D Vision glasses giving users the three-dimensional perceptual feel of seeing through the whole volume with depth info, a precursor to future visual reality and augmented reality applications; 4) Framework extension to several medical research applications across multiple domains. Here, we briefly show a few examples generated from the framework (Figures 1 to 6).
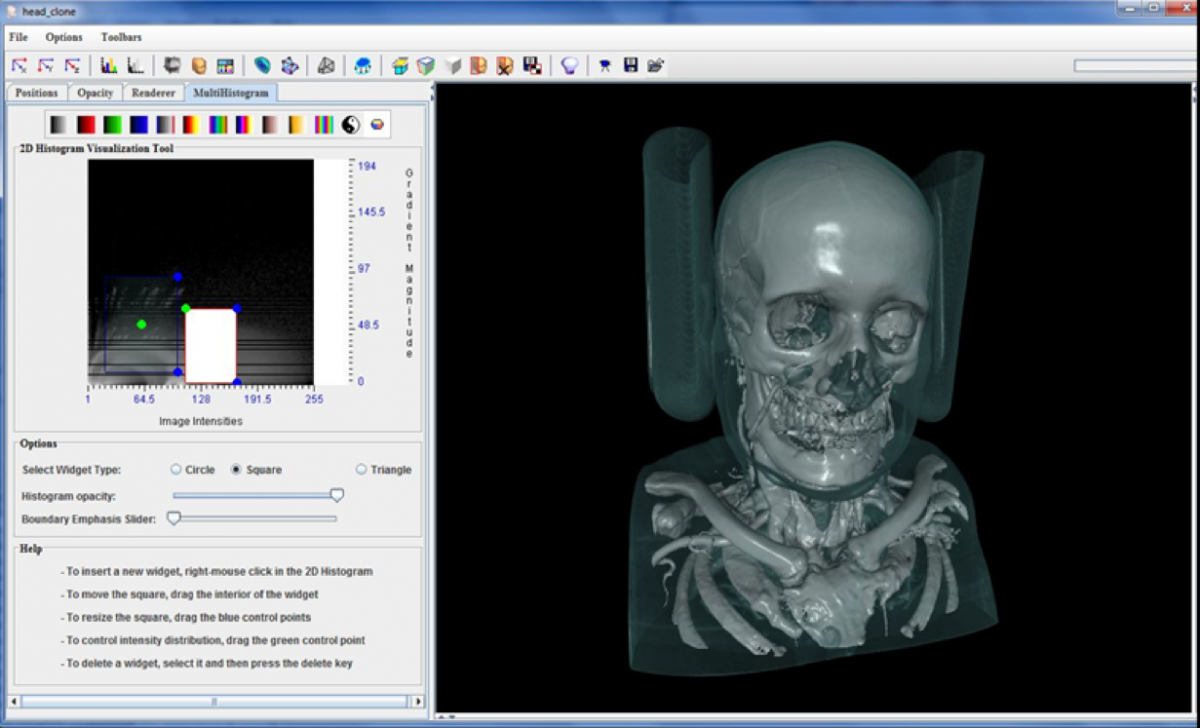
The volume rendering is implemented on the GPU with programmable shaders, using a multi-pass raycast approach. The pixel shader implementation of the volume rendering is complicated by the availability to the user of different rendering functions. Multi-histogram rendering provides visualization of multiple overlaid volumetric shapes with clear representation of the inner and outer thin layer boundaries.
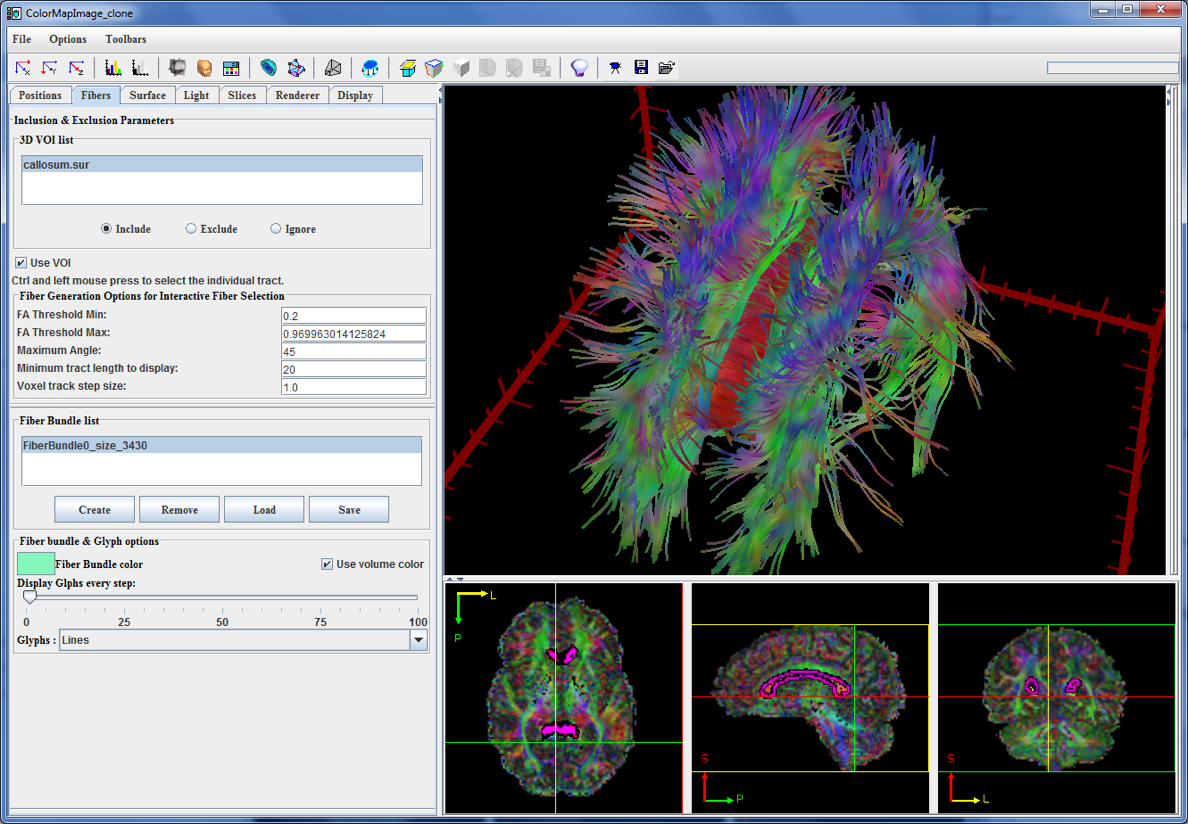
The DTI framework can visualize the fiber bundle tracks selectively and interactively. The user can specify parameters for the fiber tract generation; inter- actively including or excluding regions for displaying the tracts using either 3D volumes of interest (VOIs) or inter- active seed points on the planar view by painting with the mouse. When the user paints with the mouse, the corresponding fiber tracks or glyphs are generated automatically from the seeding points and displayed interactively.
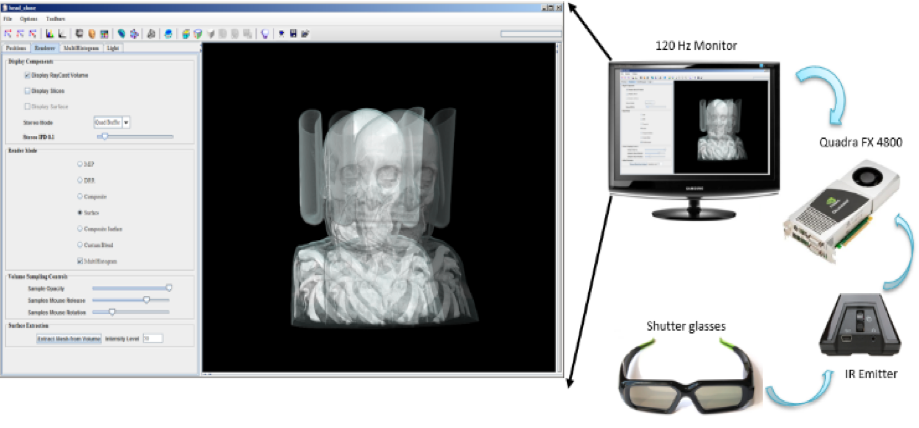
This framework provides a 3D stereo option with the NVIDIA 3D Vision Kit and OpenGL Quad-buffer rendering. The NVIDIA 3D Vision kit is superior to the traditional polarized red/cyan color stereo view because colors remain true to the original visualization. The 3D stereoscopic rendering algorithm runs on top of the existing GPU rendering pipeline. When stereo rendering is enabled, the two images of a scene are rendered from different viewpoints, one each for the left and right eye. At the hardware level, the stereoscopic system shows the left eye view for even frames and the right eye view for odd frames. The resulting image through the shutter glasses is an image that appears to have depth in front of and behind the screen. In addition to the true color 3D stereo view, this framework also implements traditional anaglyph stereo rendering with chromatically opposite colors. This gives users the flexibility to switch between the two 3D stereoscopic rendering modes.
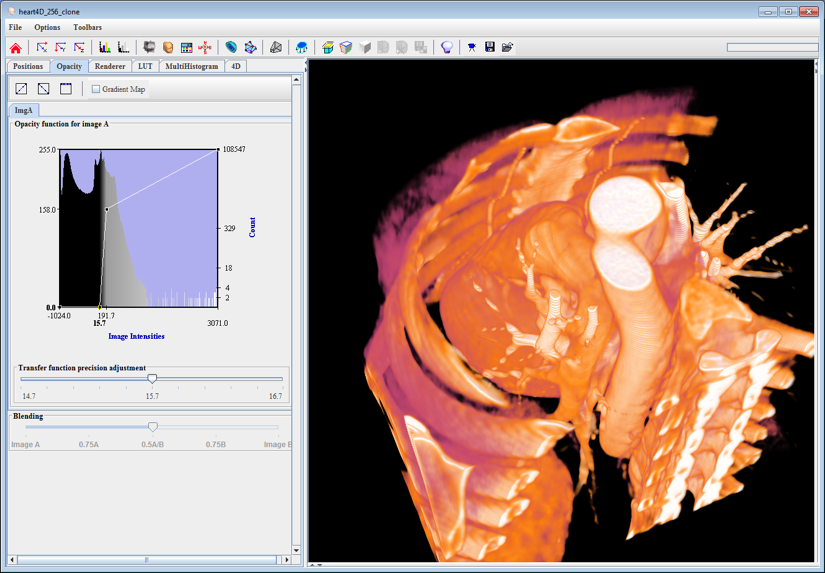
Time-series volumes display at interactive frame-rates. The user can choose to watch the volume update continuously in a loop while controlling the speed, or the user can select individual sub-volumes to examine. This technique has been used to render the volume of a beating heart in real-time while the user interactively adjusts rendering parameters.
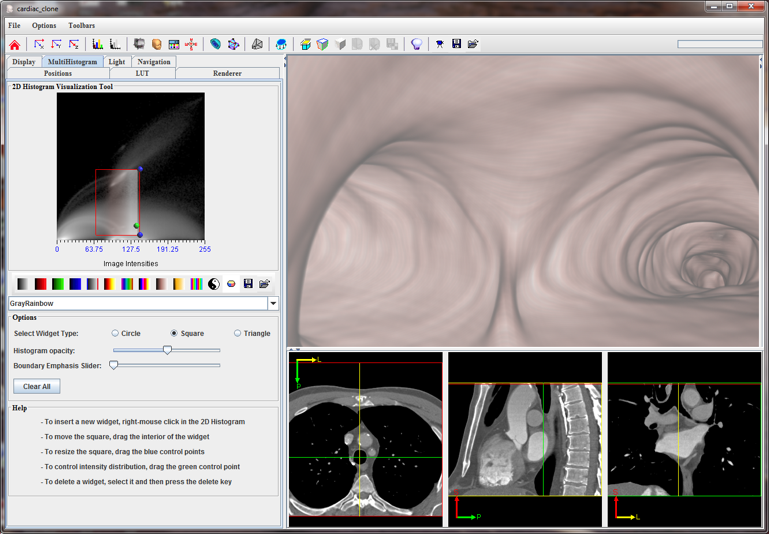
Based on the infrastructure of MIPAV visualization framework, we developed a GPU based Multi-histogram volume navigation for virtual bronchoscopy in a pure volumetric context. We developed a bronchoscopy navigation system that satisfies the following requirements: 1) Pure volumetric view without any 3D iso-surface rendering to minimize the human based segmentation errors; 2) Intuitive mouse centric navigation control that is capable of steering the surrounding anatomic structure from the viewpoint; 3) Path planning with automatic fly through; 4) Achieve high rendering quality with interactive frame rate.
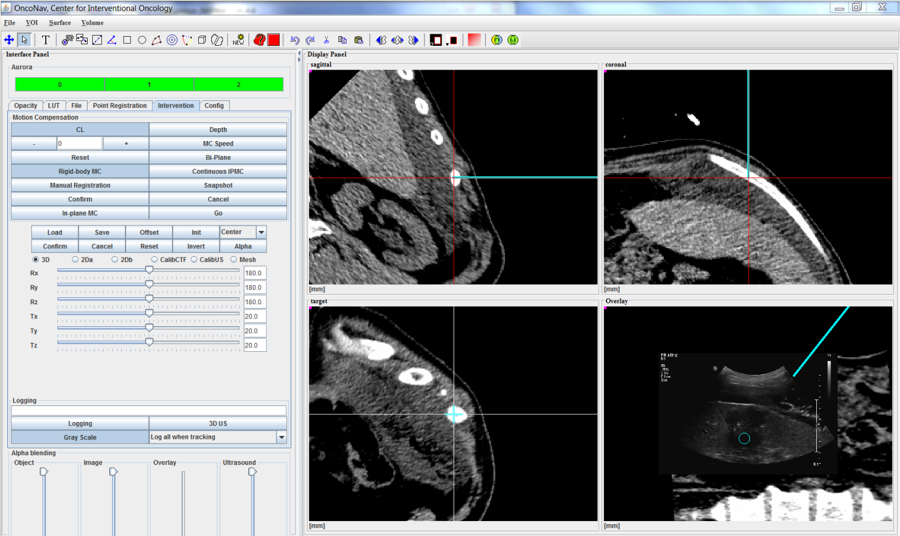
MIPVA 3D visualization component, as a framework, was integrated into Phillips oncology needle tracking software under Dr. Brad Wood’s group. The cyan color line reflects the 3D needle’s location and orientation on the ultrasound image and the corresponding CT image.