DENDRITIC MORPHOLOGY ANALYSIS
PROJECT COLLABORATORS
PUBLICATION
FIGURES
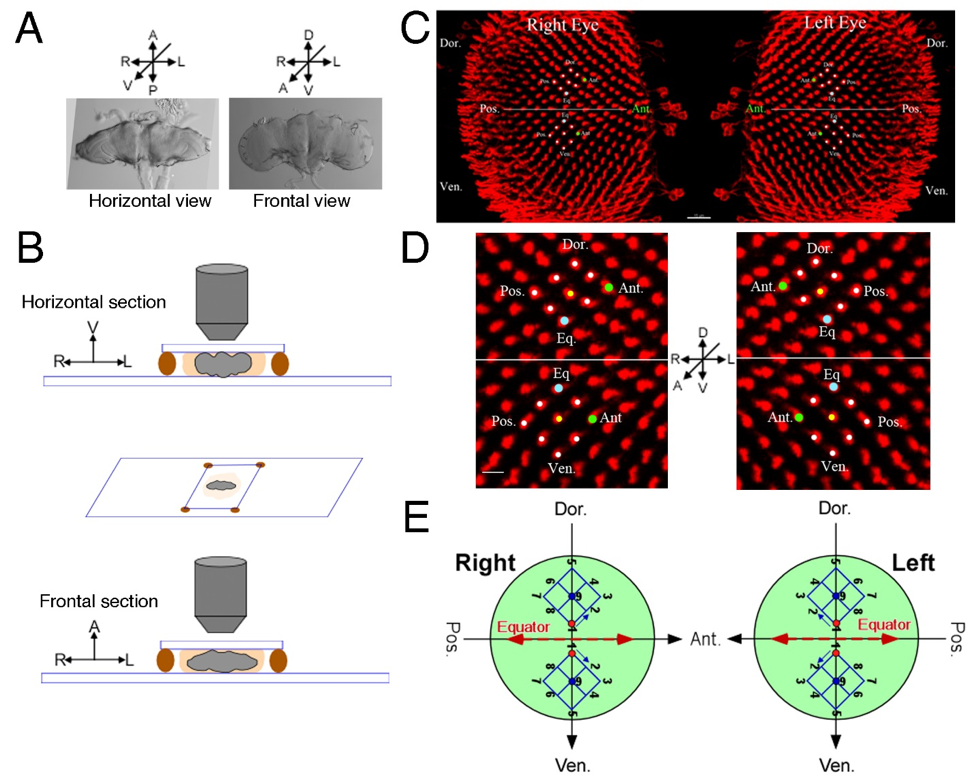
(A, B) Sample mounting for dual-view imaging. (A) The view is shown as if looking at the brain through a coverslip. (B) Schematic diagrams for sample mounting. For imaging horizontal stacks, the immuno-stained brain is mounted first at the ventral-up position. After acquiring the first stack, the brain is re-positioned in the anterior-up position for imaging the frontal stack. A: anterior; P: posterior; D: dorsal; V: ventral; R: right; L: left. (C - E) The symmetry and organization of the medulla neuropil, viewed in the frontal position. (C) Photoreceptor axons, labeled by the 24B10 antibody (red), were used to visualize the organization of the medulla neuropil. The image is shown as if looking from the outside into the brain. Ant: anterior; Pos: posterior; Dor: dorsal; Ven: ventral; Eq: equator. (D) A high-magnification view of (C) at four quadrants of the medulla neuropil at the R7 layer level. The central R7 terminals are marked by yellow dots. The anterior and equatorial R7s are labeled with green and cyan dots, respectively. (E) A schematic representation of the medulla columnar organization. Note that the left and right medulla neuropils are mirror images, and the dorsal and ventral halves of each neuropil are also mirror images, separated by the equator. Red dots indicate equatorial R7s, which are the first reference points. Numbers (1 - 9) and arrows indicate the order of reference point assignments. Scale bar: 15 µm in C; 5 µm in D.
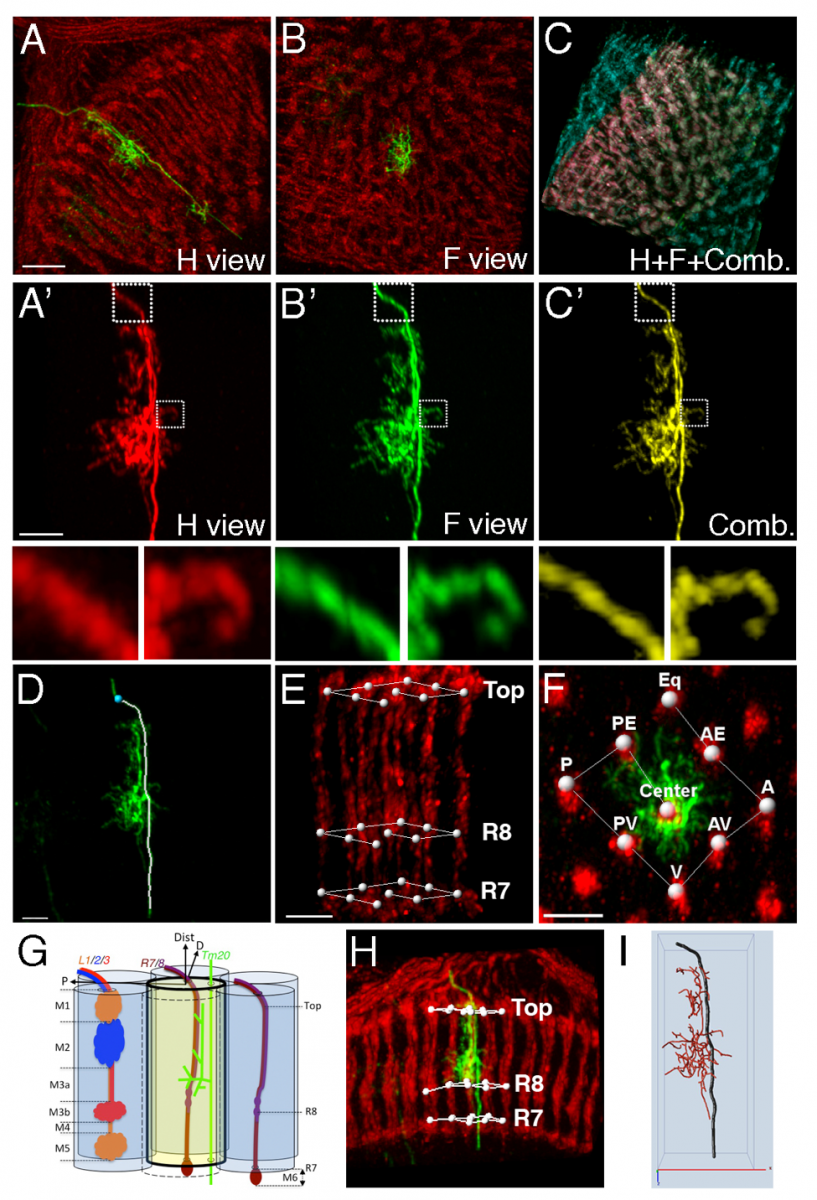
(A - C) Confocal images for a single Tm20 neuron acquired in the horizontal (A) and frontal (B) directions. Images are shown as maximum-intensity projections. Photoreceptor axons and a single Tm20 neuron are labeled with Mb24B10 antibody (red) and membrane-tethered GFP (green), respectively. (C) Recombined image of (A, red) and (B, cyan). For clarity, only photoreceptors are shown. (A' - C') Dual-imaging improves axial resolution. The recombined image (A') has a better resolution than those of the horizontal-view (A') and frontal-view (B') images. Lower panels: high-magnification views of the boxed areas in the upper panels. (D) Tracing the axon (white) of a single Tm20 neuron. The beginning point was indicated as a cyan dot. (E) The 27 reference points (white dots) on the 9 photoreceptor axons surrounding the Tm20 neurons are used as landmarks. The reference points are in three layers: Top, R8 and R7. (F) Reference point assignment in each layer. The reference point assignment follows the following order: equator (Eq), anterior-equator (AE), anterior (A), anterior-ventral (AV), ventral (V), posterior-ventral (PV), posterior (P), posterior-equator (PE), and center (C). (G) A schematic representation of the medulla column array used for registration. A Tm20 neuron is shown (green). The medulla layers (M1-6) are as indicated. (H) An example of layer and reference point assignment for a single column. Three layers are used to define each column: Top, R8, and R7 (the junction of M5/6 layers). (I) A registered and standardized neurite trace visualized using Vaa3D. Scale bar: 5 µm in A for A-C; 5 µm in A' for A'-C'; 5 µm in D, E, F, and G.